
Eurostat: 1 in 4 deaths caused by cancer in the EU28
In the EU28 in 2011, cancer was the cause of death [1] for 1.281 million persons, responsible for more than a quarter of all deaths (26.3%). Over the past ten years, while the total number of deaths slightly decreased (-0.5%), the number of deaths due to cancer increased by 6.3% (from 1.206 million in 2002 to 1.281 million in 2011), at a slightly higher pace for females (+6.6%) than for males (+6.0%). However, the number of deaths due to cancer remained higher in 2011 among the male population (718,000 deaths due to cancer) than among the female population (563,000). In 2011, cancer represented 37.1% of all causes of death for the EU28 population aged less than 65, while this level was only 23.8% for the older population (those aged 65 years and over).
Leading to the death of over 266,000 persons (or 20.8% of all deaths due to cancer), lung cancer was the main type of fatal cancer in the EU28 in 2011, followed by colorectal cancer (152,000 or 11.9%), breast cancer (93,000 or 7.2%), pancreas cancer (78,000 or 6.1%) and prostate cancer [2] (73,000 or 10.2% of all fatal cancers for the male population only).
This information was published by Eurostat, the statistical office of the European Union.
Number of deaths due to cancer in the EU28, by sex, 2002-2011

Deaths due to cancer in the EU28, by main type of cancer and sex, 2002 and 2011 (in thousands)
| All cancer | Lung cancer | Colorectal cancer | Breast cancer | Pancreatic cancer | Prostate cancer | |||||||
| 2002 | 2011 | 2002 | 2011 | 2002 | 2011 | 2002 | 2011 | 2002 | 2011 | 2002 | 2011 | |
| Total | 1 205.7 | 1 281.2 | : | 266.3 | 143.3 | 152.2 | 91.7 | 92.7 | 62.3 | 78.1 | - | - |
| Men, total | 677.4 | 717.9 | : | 186.5 | 75.2 | 82.7 | 1.1 | 0.9 | 31.2 | 39.2 | 67.5 | 72.9 |
| Women, total | 528.3 | 563.2 | : | 79.8 | 68.1 | 69.5 | 90.6 | 91.8 | 31.1 | 38.9 | - | - |
: not available
- not applicable
Cancer: responsible for nearly 40% of deaths among those aged less than 65, and under 25% amongst those aged 65 and over
Among the total population, cancer was in 2011 the cause of more than 30% of deaths in the Netherlands (31.9%), Slovenia (31.3%) and Ireland (30.5%), while it represented less than a fifth of all causes of death in Bulgaria (15.6%), Romania (19.1%) and Lithuania (19.9%). At least a quarter of deaths were due to cancer in seventeen Member States in 2011.
Looking at age groups, 345,000 persons aged less than 65 died in 2011 in the EU28 because of cancer, meaning that cancers represented more than a third (37.1%) of all causes of death for this age group. Among Member States, death due to cancer for people aged less than 65 accounted for more than 40% of all causes of death in the Netherlands (48.0%), Italy (45.2%), Spain (43.9%) and Slovenia (40.9%), but less than 30% in Lithuania (23.2%), Latvia (24.2%), Estonia (26.3%), Bulgaria (26.7%) and Finland (28.4%).
For the population aged 65 and over, cancer represented almost a quarter (23.8% or 936,000 persons) of all causes of deaths in the EU28 in 2011, with the highest shares registered in Slovenia (28.8%), Ireland (28.4%), the Netherlands (28.3%), Denmark (27.6%) and the United Kingdom (27.2%), and the lowest in Bulgaria (12.3%) and Romania (15.2%).
Deaths due to cancer in the EU28 Member States, by age group, 2011
(absolute numbers & shares in total causes of death)
| Deaths due to cancer total population | Deaths due to cancer population aged less than 65 | Deaths due to cancer population aged 65 and over | ||||
| Absolute number | Share in all causes of death (%) | Absolute number | Share in all causes of death (%) | Absolute number | Share in all causes of death (%) | |
| EU28 | 1 281 153 | 26.3 | 345 033 | 37.1 | 936 114 | 23.8 |
| Belgium | 27 639 | 26.5 | 7 119 | 37.0 | 20 520 | 24.1 |
| Bulgaria | 16 822 | 15.6 | 6 593 | 26.7 | 10 229 | 12.3 |
| Czech Rep. | 27 244 | 25.4 | 8 538 | 34.5 | 18 706 | 22.7 |
| Denmark | 15 481 | 29.6 | 3 689 | 38.1 | 11 792 | 27.6 |
| Germany | 221 693 | 26.0 | 52 887 | 38.1 | 168 806 | 23.6 |
| Estonia | 3 629 | 23.8 | 1 009 | 26.3 | 2 620 | 23.0 |
| Ireland | 8 667 | 30.5 | 2 352 | 37.8 | 6 315 | 28.4 |
| Greece | 27 342 | 24.6 | 6 488 | 37.6 | 20 854 | 22.2 |
| Spain | 105 432 | 27.2 | 27 140 | 43.9 | 78 292 | 24.0 |
| France | 155 160 | 28.4 | 44 562 | 39.8 | 110 598 | 25.4 |
| Croatia | 13 701 | 26.6 | 4 220 | 39.9 | 9 481 | 23.2 |
| Italy | 167 883 | 28.3 | 34 828 | 45.2 | 133 054 | 25.7 |
| Cyprus | 1 151 | 21.3 | 326 | 34.0 | 825 | 18.6 |
| Latvia | 5 890 | 20.6 | 1 848 | 24.2 | 4 042 | 19.3 |
| Lithuania | 8 070 | 19.9 | 2 634 | 23.2 | 5 436 | 18.7 |
| Luxembourg | 1 060 | 27.8 | 296 | 38.0 | 764 | 25.1 |
| Hungary | 32 670 | 25.4 | 12 624 | 36.5 | 20 046 | 21.3 |
| Malta | 875 | 26.4 | 247 | 39.1 | 628 | 23.4 |
| Netherlands | 43 017 | 31.9 | 11 763 | 48.0 | 31 249 | 28.3 |
| Austria | 20 104 | 26.4 | 5 128 | 38.1 | 14 976 | 23.9 |
| Poland | 92 270 | 24.5 | 34 726 | 30.6 | 57 544 | 21.9 |
| Portugal | 25 590 | 24.8 | 7 098 | 38.9 | 18 492 | 21.8 |
| Romania | 47 980 | 19.1 | 19 591 | 30.0 | 28 389 | 15.2 |
| Slovenia | 5 865 | 31.3 | 1 592 | 40.9 | 4 273 | 28.8 |
| Slovakia | 12 917 | 25.1 | 4 869 | 33.4 | 8 048 | 21.8 |
| Finland | 11 580 | 23.0 | 2 879 | 28.4 | 8 701 | 21.6 |
| Sweden | 21 747 | 24.3 | 4 278 | 37.3 | 17 469 | 22.4 |
| United Kingdom | 159 674 | 29.0 | 35 709 | 37.9 | 123 965 | 27.2 |
| Norway | 10 839 | 26.2 | 2 493 | 37.2 | 8 346 | 24.1 |
| Switzerland | 16 736 | 26.7 | 3 995 | 40.5 | 12 741 | 24.1 |
Figures may not add up due to deaths of unknown age.
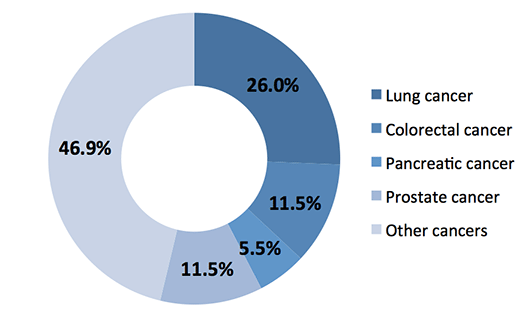
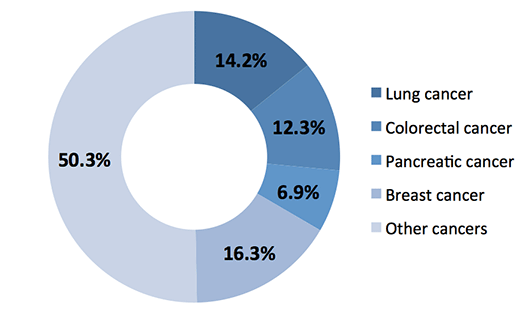
Fatal cancers in the EU28 by main type of cancer and sex (%), 2011
Males |
Females |
 |
 |
| Lung cancer is the most common fatal cancer for males in the EU28. |
Breast cancer is the most common fatal cancer for females in the EU28. |
Highest proportion of both fatal lung cancer and colorectal cancer in Hungary
In all Member States, the most prevalent cancer leading to death in 2011 was lung cancer, except in Portugal where it was colorectal cancer.
The highest proportions of lung cancer among all deaths due to cancer were recorded in Hungary (26.1%), the Netherlands (24.6%), Belgium (24.5%) Greece and Poland (both 24.1%), and the lowest in Portugal (14.5%), Sweden (16.7%), Latvia (16.8%), Lithuania and Slovakia (both 17.1%). Compared with 2002, the proportions of lung cancer among all deaths due to cancer increased in fourteen Member States, decreased in ten and remained almost stable in Slovenia and Finland.
In 2011, the highest proportions of deaths due to colorectal cancer among all deaths due to cancer were registered in Hungary (15.5%), Slovakia (15.3%), Portugal (15.0%), Croatia (14.7%) and Spain (14.6%). On the opposite end of the scale, colorectal cancer represented less than 10% of all deaths due to cancer in Cyprus (7.9%), Greece (8.9%) and Finland (9.8%).
Highest proportion of fatal prostate cancer in the Nordic Member States
Prostate cancer represented in 2011 the fifth main type of fatal cancer in the EU28, with a 5.7% share in all deaths due to cancer. Prostate cancer however only affects men, for whom it caused 10.2% of all deaths due to cancer in 2011 in the EU28.
Among Member States, the highest shares were observed in the three Nordic Member States: Sweden (11.0% of deaths due to cancer in the total population, and 20.9% of all deaths due to cancer among the male population), Denmark (7.9% and 15.1%) and Finland (7.6% and 14.4%).
On the contrary, shares of less than 5% of all deaths due to cancer in the total population were recorded in Hungary (3.7% of deaths due to cancer in the total population, and 6.7% of all deaths due to cancer among the male population), Malta (4.0% and 7.4%), Romania (4.1% and 6.9%), Poland (4.4% and 7.9%), Italy (4.5% and 8.0%), Luxembourg (4.7% and 8.6%), the Czech Republic (4.8% and 8.7%) and Slovakia (4.9% and 8.4%).
Deaths due to cancer in the EU28 Member States, by main type of cancer, 2002 and 2011
(respective shares in total fatal cancer)
| Lung cancer | Colorectal cancer | Breast cancer | Pancreatic cancer | Prostate cancer* | ||||||
| 2002 | 2011 | 2002 | 2011 | 2002 | 2011 | 2002 | 2011 | 2002 | 2011 | |
| EU28 | : | 20.8 | 11.9 | 11.9 | 7.6 | 7.2 | 5.2 | 6.1 | 5.6 | 5.7 |
| Belgium** | 23.8 | 24.5 | 11.0 | 10.8 | 8.7 | 8.8 | 5.1 | 6.0 | 5.6 | 5.5 |
| Bulgaria | 19.0 | 19.9 | 13.9 | 13.9 | 7.0 | 7.8 | 5.2 | 5.7 | 4.8 | 5.3 |
| Czech Rep. | 19.4 | 20.6 | 15.5 | 13.6 | 6.9 | 6.4 | 5.6 | 7.5 | 4.9 | 4.8 |
| Denmark | 22.2 | 23.4 | 13.2 | 12.7 | 9.4 | 7.9 | 4.7 | 5.8 | 7.7 | 7.9 |
| Germany | : | 19.8 | 13.7 | 11.9 | 8.6 | 8.1 | 6.1 | 7.2 | 5.4 | 6.0 |
| Estonia | 20.0 | 17.9 | 12.0 | 11.9 | 7.6 | 7.1 | 5.3 | 7.1 | 5.2 | 6.1 |
| Ireland | 19.6 | 21.3 | 12.0 | 12.0 | 8.1 | 8.0 | 5.2 | 5.5 | 7.2 | 6.5 |
| Greece | 23.2 | 24.1 | 8.1 | 8.9 | 7.3 | 6.9 | 4.9 | 5.7 | 5.4 | 5.6 |
| Spain | 19.2 | 20.0 | 12.9 | 14.6 | 6.2 | 6.1 | 4.5 | 5.5 | 6.0 | 5.7 |
| France | 17.5 | 19.5 | 11.0 | 11.2 | 7.7 | 7.6 | 5.1 | 6.1 | 6.4 | 5.8 |
| Croatia | 21.5 | 20.8 | 12.9 | 14.7 | 6.8 | 6.6 | 4.5 | 5.0 | 4.0 | 5.5 |
| Italy | 20.6 | 20.1 | 11.0 | 11.4 | 7.3 | 7.2 | 5.4 | 6.4 | 4.5 | 4.5 |
| Cyprus** | 17.0 | 20.4 | 9.7 | 7.9 | 9.1 | 9.8 | 5.0 | 4.6 | 8.4 | 7.0 |
| Latvia | 18.8 | 16.8 | 11.2 | 11.7 | 7.8 | 7.6 | 5.9 | 6.5 | 5.1 | 6.3 |
| Lithuania | 18.0 | 17.1 | 11.1 | 11.8 | 7.1 | 6.7 | 5.6 | 5.6 | 5.4 | 6.3 |
| Luxembourg | 20.1 | 19.9 | 12.6 | 11.6 | 8.1 | 7.9 | 7.0 | 6.8 | 4.4 | 4.7 |
| Hungary | 24.0 | 26.1 | 14.5 | 15.5 | 6.9 | 6.6 | 5.1 | 5.7 | 3.9 | 3.7 |
| Malta | 18.7 | 18.1 | 13.0 | 12.6 | 9.0 | 9.7 | 7.6 | 7.3 | 4.6 | 4.0 |
| Netherlands | : | 24.6 | 11.6 | 11.9 | 9.2 | 7.7 | 4.9 | 5.9 | 6.2 | 5.8 |
| Austria | 18.4 | 18.1 | 13.3 | 10.8 | 8.6 | 7.5 | 6.7 | 7.7 | 6.1 | 5.7 |
| Poland** | 24.5 | 24.1 | 10.3 | 11.6 | 5.6 | 6.0 | 4.3 | 4.8 | 4.0 | 4.4 |
| Portugal | 13.6 | 14.5 | 14.1 | 15.0 | 7.1 | 6.5 | 4.3 | 5.0 | 7.6 | 7.1 |
| Romania | 20.0 | 20.4 | 10.0 | 11.6 | 7.1 | 6.7 | 5.0 | 5.6 | 3.6 | 4.1 |
| Slovenia | 19.0 | 19.1 | 13.5 | 13.2 | 8.6 | 7.0 | 5.0 | 6.3 | 5.6 | 6.6 |
| Slovakia | 17.6 | 17.1 | 15.4 | 15.3 | 6.6 | 7.0 | 4.7 | 6.0 | 4.1 | 4.9 |
| Finland | 18.1 | 18.2 | 9.7 | 9.8 | 7.7 | 7.2 | 7.4 | 8.7 | 7.9 | 7.6 |
| Sweden | 14.7 | 16.7 | 12.0 | 12.4 | 7.0 | 6.5 | 6.8 | 7.3 | 11.0 | 11.0 |
| United Kingdom | 21.6 | 22.1 | 10.4 | 10.0 | 8.3 | 7.4 | 4.4 | 5.2 | 6.4 | 6.8 |
| Norway | 18.0 | 20.1 | 15.2 | 14.3 | 7.0 | 5.6 | 6.1 | 6.0 | 10.0 | 9.7 |
| Switzerland | 17.8 | 19.3 | 10.5 | 11.0 | 8.9 | 8.4 | 6.4 | 6.8 | 8.3 | 8.3 |
| : | not available |
| * | Share of prostate cancer in cancer deaths of the total population i.e. males and females. |
| ** | Belgium: 2003 data instead of 2002; Cyprus: 2004 data instead of 2002. Poland: data on lung cancer for 2005 instead of 2002. |
Notes
- Eurostat collects statistics on the causes of death according to a list of 86 different causes of death. The list is available at: http://ec.europa.eu/eurostat/ramon/nomenclatures/index.cfm?TargetUrl=LST_NOM_DTL&StrNom=COD_2012&StrLanguag eCode=EN&IntPcKey=&StrLayoutCode=HIERARCHIC
- Prostate cancer only occurs for males.
Keywords: European Union, cancer-related deaths
25. 11. 2014 Eurostat News Release